So I've continued to make a small trickle of sales of my designs (mostly
Baby's Book of Computer Science). On the Spoonflower account pages, they show you a chronological list of all your sales. I was curious how some of the other designs stacked up, and started brainstorming how I could scrape all the data off the page and into, say, a spreadsheet. Then it occurred to me that, since I've been doing more front-end Javascript development in my day job, perhaps I could write it as a browser plugin and just add whatever statistics I wanted directly to the page itself! And the added bonus of doing it that was is that I could share it with other people.
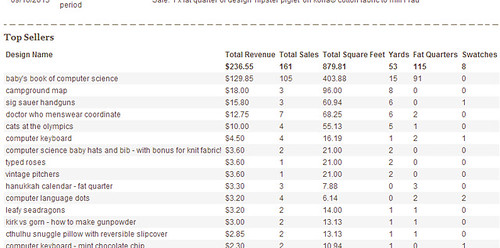
So I took a couple of hours and did just that. I managed to get it working in Chrome and Firefox. (For reference, plugin development is MUCH easier and more clearly documented for Chrome.) Here's a screenshot of what it looks like in place:

The plugin (and installation instructions) are
here. I was very nervous about having others try it out, since I could only test it with my own data, and there could easily be other types of sales that would break my code. I offered it to the Synergy group though, and so far a couple of people have tried it out and said it works. Exciting!

No comments:
Post a Comment